
The past couple of weeks have been a flurry of activity and productivity; enough to merit checking in with folks and sharing what I have been up to and what I have learned.
I’ve been busy refactoring the core views which drive Dex visualizations; spending a ton of time in the Javascript visuals. I’m like a kid in a candy story, excited about how things are coming together.
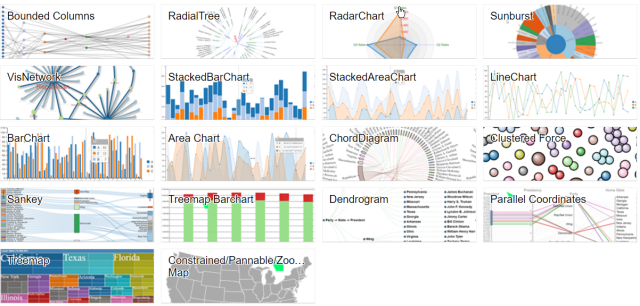
I finally decided to share small examples of the work via gists and blocks. Here is a series of them that I have created in the past week or so:
Click the image below to go there:
Most of the changes have already found their way into Dex and I’ve checked in a ton of changes into the github site. If you get your Dex release via git, its worth checking out.
Assuming you have git installed and Java 8 (I use revision 121 currently, but lower versions of Java 8 will probably work), installation can be done in 3 steps.
-
git clone https://github.com/PatMartin/Dex.git
-
cd Dex -
java -jar Dex.jar
If you get it via official releases, it’ll be awhile before I package another one up. It’s time consuming and I don’t feel like breaking stride just yet.
Next, I’ve been putting effort into the dexjs site. I think that I prefer it as both a website and blogging facility. Once I work all the kinks out of it, I’ll be migrating Dex into something separate,but similar.
The main reason for the move is control. I am using Hugo to deploy the static site and I end up having much more control over the content. It’s not as polished looking as wordpress.com but I feel it can be as good or better in the long run.
Most importantly, rather than linking to external sites for live content, I can embed it directly into the discussion. As the blog posts I’ve been writing over there indicate. Here are a few of them:
- Introducing the new Treemap – Here I introduce a new Treemap which is also available in Dex. Having live examples inline in the blog article really makes a difference.
- D3 v3/v4 Cohabitation – Here I discuss a technique for mixing two incompatible versions of the same library (D3) into the same framework and getting them actually to interact well weith one another.
- Treemap Bar Chart – Here I introduce a brand new visual which will be coming to Dex soon. Check it out, it’s awesome!
Now on Github
- Lots of bug fixes, including the ability to cleanly terminate a flow.
- All of the dexjs charts are vastly improved and some new ones are here
- Network
- Ring Network
- Treemap
- You can now script in Ruby within Dex!
- Line Chart Multiples
- Database interaction improvements such as strict type creation for HyperSQL
- Selenium updates
- Much more…
Coming soon…
- Maps and the ability to visualize them in all sorts of ways
- Better documentation, I can barely keep up!
Final Thoughts
Lastly, now that ANTLR has a Javascript target, I am considering writing a web based language for data visualization. I haven’t forgotten the dream that Brett Victor left me with in his series on Drawing Dynamic Visualizations and Stop Drawing Dead Fish. I feel that a more expressive language might be the gateway to achieving this.
While Dex provides an easy way to manipulate data and a wide variety of output templates, it falls very short of Brett’s vision.
Lastly, just so this idea doesn’t die, I was thinking about creating a tool which allows Force Tree visualization of the DOM tree in realtime. This would come in handy for debugging other visuals which manipulate the DOM and allow me a tool for quickly understanding the anatomy of a visual and how it changes as one interacts with it. Maybe tieing the Player and Network components together from dex.js and storing DOM changes in frames so that I could play through them.
Oh, and Happy New Year!!
- Pat
