I have deployed a new website for Dex which also contains a new release (dex-0.9.0.0).
I will deprecate this blog and instead start blogging about Dex on the new site’s blog.
I have deployed a new website for Dex which also contains a new release (dex-0.9.0.0).
I will deprecate this blog and instead start blogging about Dex on the new site’s blog.
The past couple of weeks have been a flurry of activity and productivity; enough to merit checking in with folks and sharing what I have been up to and what I have learned.
I’ve been busy refactoring the core views which drive Dex visualizations; spending a ton of time in the Javascript visuals. I’m like a kid in a candy story, excited about how things are coming together.
I finally decided to share small examples of the work via gists and blocks. Here is a series of them that I have created in the past week or so:
Click the image below to go there:
Most of the changes have already found their way into Dex and I’ve checked in a ton of changes into the github site. If you get your Dex release via git, its worth checking out.
Assuming you have git installed and Java 8 (I use revision 121 currently, but lower versions of Java 8 will probably work), installation can be done in 3 steps.
git clone https://github.com/PatMartin/Dex.git
cd Dex
java -jar Dex.jar
If you get it via official releases, it’ll be awhile before I package another one up. It’s time consuming and I don’t feel like breaking stride just yet.
Next, I’ve been putting effort into the dexjs site. I think that I prefer it as both a website and blogging facility. Once I work all the kinks out of it, I’ll be migrating Dex into something separate,but similar.
The main reason for the move is control. I am using Hugo to deploy the static site and I end up having much more control over the content. It’s not as polished looking as wordpress.com but I feel it can be as good or better in the long run.
Most importantly, rather than linking to external sites for live content, I can embed it directly into the discussion. As the blog posts I’ve been writing over there indicate. Here are a few of them:
Lastly, now that ANTLR has a Javascript target, I am considering writing a web based language for data visualization. I haven’t forgotten the dream that Brett Victor left me with in his series on Drawing Dynamic Visualizations and Stop Drawing Dead Fish. I feel that a more expressive language might be the gateway to achieving this.
While Dex provides an easy way to manipulate data and a wide variety of output templates, it falls very short of Brett’s vision.
Lastly, just so this idea doesn’t die, I was thinking about creating a tool which allows Force Tree visualization of the DOM tree in realtime. This would come in handy for debugging other visuals which manipulate the DOM and allow me a tool for quickly understanding the anatomy of a visual and how it changes as one interacts with it. Maybe tieing the Player and Network components together from dex.js and storing DOM changes in frames so that I could play through them.
Oh, and Happy New Year!!
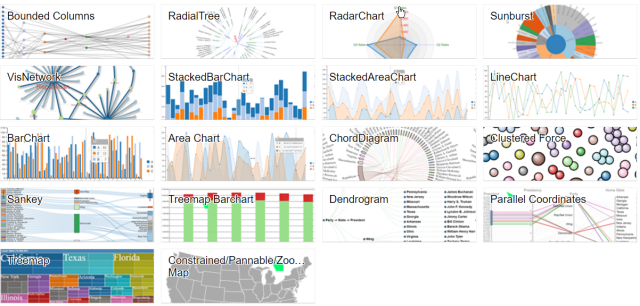
In the spirit of promoting dex.js as a separate but foundation technology of Dex, I have created a new site called dexjs.net which is fully dedicated to sharing information pertaining to the javascript framework.
There are also a number of tutorials and live examples on the site.
I really struggled and spent tons of my vacation time trying to figure out which static site generator I could get most productive with. I wanted to be able to write documentation, blog entries and such with live javascript embedded within rather than through remotely hosted links like I have to do with wordpress.
The verdict? I finally decided on Hugo in spite of the seemingly greater popularity of Jekyll. The main reason for me was ease of use and much fewer dependencies. It’s also super-fast with a live-update option I’ve grown to love.
If everything works out, I’ll also be migrating this blog over as well. But first, I want to work the kinks out of using Hugo with dexjs.net for awhile.
In case you missed it:
dex.js has been becoming a foundation visualization technology in Dex for the past year or so. However, as is common with coders, I realized that I haven’t really done much to market it whatsoever. So I figured I’d put a presentation together using reveal.js and host it via github pages. Relevant links can be found here:
All of this is a work in progress, but I hope this helps bridge the awareness gap some.
If you recently tried to go to the main Dex site and saw GoDaddy Cash Parking advertisements instead; here is why:
GoDaddy apparently has set up a program for domain squatters to gain revenue from previously active domains. The domain owner (in my case a squatter who pounced on my domain once GoDaddy failed to auto-renew it) then makes revenue off of a parked site based upon advertisement. In turn, GoDaddy gets a nominal monthly fee for the Cash Parking service.
Basically, they create a market for this bad behavior.
So I switched my registrar and the domain which ties to the Dex project.
There’s lots of talk nowdays about the cloud, containerization, so I decided to see what it would take to run a JavaFX application within a docker container.
It took a bit of work to figure out, but it works great.
Due to some Oracle licensing requirements the version of Oracle Java 8 is not bundled like normal linux packages, but rather has to be downloaded and installed from a special repository called webupd8. This small amount of additional complexity is also reflected in the Dockerfile we will cover below.
Why bother bundling an application with Docker? Well, there are many reasons.
Without further adieu, here’s my Dockerfile, let’s walk through it.
###
#
# Dex Dockerfile installation:
#
# build:
#
# docker build -t dex .
#
# run:
#
# docker run -v /tmp/.X11-unix:/tmp/.X11-unix -e DISPLAY=unix$DISPLAY dex
#
###

# pull base image
FROM debian:jessie

RUN \
    echo "===> add webupd8 repository..."  && \
    echo "deb http://ppa.launchpad.net/webupd8team/java/ubuntu trusty main" | tee /etc/apt/sources.list.d/webupd8team-java.list  && \
    echo "deb-src http://ppa.launchpad.net/webupd8team/java/ubuntu trusty main" | tee -a /etc/apt/sources.list.d/webupd8team-java.list  && \
    echo "deb http://ftp.de.debian.org/debian jessie main" >> /etc/apt/sources.list && \
    apt-key adv --keyserver keyserver.ubuntu.com --recv-keys EEA14886 && \
    apt-get update && \
    apt-get install -y gtk2-engines libxtst6 libxxf86vm1 freeglut3 libxslt1.1 && \
    apt-get update  && \
    \
    echo "===> install Java"  && \
    echo debconf shared/accepted-oracle-license-v1-1 select true | debconf-set-selections  && \
    echo debconf shared/accepted-oracle-license-v1-1 seen true | debconf-set-selections  && \
    DEBIAN_FRONTEND=noninteractive  apt-get install -y --force-yes oracle-java8-installer oracle-java8-set-default  && \
    \
        apt-get install -y git && \
        cd ~ && git clone https://github.com/PatMartin/Dex.git && \
    \
    echo "===> clean up..."  && \
    rm -rf /var/cache/oracle-jdk8-installer && \
    apt-get clean  && \
    rm -rf /var/lib/apt/lists/*

# cd to the Dex directory and execute the jar.
CMD cd ~/Dex && java -jar Dex.jar
In line 16 we see:
FROM debian:jessie
This simply tells docker to download, install and use a base debian installation using the jesse release as our base imate.
Step 2:
Next on lines 18 through 39 we see a pretty intimidating command:
RUN \
 echo "===> add webupd8 repository..." && \
 echo "deb http://ppa.launchpad.net/webupd8team/java/ubuntu trusty main" | tee /etc/apt/sources.list.d/webupd8team-java.list && \
 echo "deb-src http://ppa.launchpad.net/webupd8team/java/ubuntu trusty main" | tee -a /etc/apt/sources.list.d/webupd8team-java.list && \
 echo "deb http://ftp.de.debian.org/debian jessie main" >> /etc/apt/sources.list && \
 apt-key adv --keyserver keyserver.ubuntu.com --recv-keys EEA14886 && \
 apt-get update && \
 apt-get install -y gtk2-engines libxtst6 libxxf86vm1 freeglut3 libxslt1.1 && \
 apt-get update && \
 \
 echo "===> install Java" && \
 echo debconf shared/accepted-oracle-license-v1-1 select true | debconf-set-selections && \
 echo debconf shared/accepted-oracle-license-v1-1 seen true | debconf-set-selections && \
 DEBIAN_FRONTEND=noninteractive apt-get install -y --force-yes oracle-java8-installer oracle-java8-set-default && \
 \
 apt-get install -y git && \
 cd ~ && git clone https://github.com/PatMartin/Dex.git && \
 \
 echo "===> clean up..." && \
 rm -rf /var/cache/oracle-jdk8-installer && \
 apt-get clean && \
 rm -rf /var/lib/apt/lists/*
It would be nice to break it up some, but there’s a good reason that we don’t. Multiple RUNs within a Dockerfile will cause the creation of multiple layers; one per RUN. We’re trying to minimize this, and the objective causes some ugliness. It’s necessary though.
Basically, this command is performing the following task:
Building from Dockerfile
Assuming docker is installed and running, drop the Dockerfile described above into an empty directory somewhere.
Issuing the command:
docker build -t dex .
Will create a dex image. It’ll take a few minutes to run. Remember, it’s creating a vm image, updating it to spec, installing oracle and dex. That’s a lot!
Next, we can run it from an X11 capable linux client like this:
xhost +
docker run -v /tmp/.X11-unix:/tmp/.X11-unix -e DISPLAY=unix$DISPLAY dex
It should be possible to run like this from Windows or OSX, but I haven’t tried it personally.
Anyway, that’s it for now…Good luck!
Finally, we are truly open source software. The source code for Dex is now on github. The repository can be found here.
Also, the living documentation is in gitbook form and can be found here.
I have come to the conclusion that specialized wrapper/runner systems such as Grunt and Gulp are unnecessary technical debt. I had previously been using Gulp and all the pertinent Gulp add-ons that I needed and it was a source of complexity.
So I decided to port a codebase into a new data visualization project called dex.js.
Previously, in my node_modules directory I had 54 node packages spread across 31,239 files taking up 343M of disk space. That’s a lot of overhead for a javascript visualization library!
$ ls -1 node_modules/|wc -l
54

$ find node_modules -name \* | wc -l
31239

$ du -sh node_modules
343M node_modules
As I considered ripping all of this out with a simple Makefile replacement, I came across an insightful article “Why we should stop using Grunt & Gulp” written by Keith Cirkel. He follows up with a prescriptive article “How to us NPM as a build tool”.
Keith points out that adding layers like Grunt/Gulp contribute complexity, unnecessary dependencies and bloat to your project.
By using npm and a well configured package.json, you can reduce the complexity greatly.
So I decided to put it to the test…
Things are much simplier now. I have a package.json that specifies how my application is laid out and defines a few scripts for creating build distributions, testing and creating documentation.
package.json:
{
  "name": "dexjs",
  "description": "dexjs : dexvis javascript visualization component library.",
  "version": "0.1.0",
  "license": "Apache-2.0",
  "keywords": [
    "chart",
    "charting",
    "dataviz",
    "visualization",
    "c3",
    "d3"
  ],
  "homepage": "http://dexvis.com",
  "email"   : "patrick145@msn.com",
  "url"     : "https://dexvis.wordpress.com",
  "files": [
    "src/dex.js"
  ],
  "main": "dex",
  "repository": {
    "type": "git",
    "url": "https://www.github.com/PatMartin/dexjs.git"
  },
  "dependencies": {
    "jquery": "latest",
    "underscore": "latest"
  },
  "devDependencies": {
    "jshint": "latest",
    "jasmine": "latest",
    "browserify": "latest"
  },
  "scripts": {
    "lint": "jshint src/**.js",
    "docs": "jsdoc -c conf.json -t ./node_modules/ink-docstrap/template -R README.md",
    "build": "browserify src/dex.js --standalone dex > dist/dex.js && browserify src/dex.js --standalone dex | uglifyjs > dist/dex.min.js && browserify src/dex.maps.js --standalone dex > dist/dex.maps.js && browserify src/dex.maps.js --standalone dex | uglifyjs > dist/dex.maps.min.js",
    "test": "jasmine SpecRunner.html"
  }
}
I have my main 4 task defined as scripts. Within WebStorm I can execue individual scripts with a single button click. It’s minimalistic, though script strings can get unwieldy. Here are my new set of dependencies. I now have 7 package dependencies spread across 6,750 files taking up a total of 45M of disk space. That’s much better than my previous 54 node packages spread across 31,239 files taking up 343M of disk space.
$ ls -1 node_modules/|wc -l
7

$ find node_modules/ -name \* | wc -l
6760

$ du -sh node_modules
45M node_modules
I also get rid of 6-7 gulpfiles and targets and my build system is a lot more understandable, much less complex with an order of magnitude fewer dependencies.
From here, I am going to focus on defining a package.json compliant enough to allow for distribution via npm in addition to the github repository.
Finally, it feels like my build system is working for me rather than creating work for me.
Lately I’ve been droning on about the reusable player and the merits of being able to create frames of data which may be played out across a dimension (typically time). I think the first time I really saw this in action was watching Hans Rosling present “200 Countries, 200 Years, 4 Minutes – The Joy of Stats”. To me, it looked like science fiction; at first glance.
Being an engineer, I condensed this in my head as 200 series, consisting of 200 samples with an x and a y value. Roughly 200 x 200 x 2 datapoints depending on sparseness of the sampling. Roughly 80,000 data values represented by 40,000 data points presented in manner understandable by virtually anyone. 40,000 points on a screen would look like chaos and would be difficult from which to derive anything insightful. Removing a dimension via framing or partitioning; in this case the dimension of time, reduces the number of points on the screen at any given time to a much more manageable 200; albeit this is still a lot for the human brain to handle. Series selection and filters come to the rescue.
One of the downsides of partitioning, or framing out a dimension is that you may only view one frame at a time. Something that Gapminder solved by adding trails to selected series. Literally providing the best of both worlds. A tremendous reduction in visual clutter without loss of signal. The ability to show multiple trails allows for direct comparison between two series.
So the other day, serendipity struck in the form of a tweet which informed me of a pre-alpha project called Vizabi, a Javascript project on Github which leverages D3js to provide those wonderfully insightful Gapminder charts. Aha! The geniuses at Gapminder are sharing their secrets at long last! I’m looking forward to peeking under the hood. Anyone reading this should check it out.
This is a compelling view within Gapminder because it relates prosperity to quality of life. There is no greater common instinct in human beings more powerful than protecting our children. This is a great view on the overall health and direction of a nation.
Click the image to see for yourself.
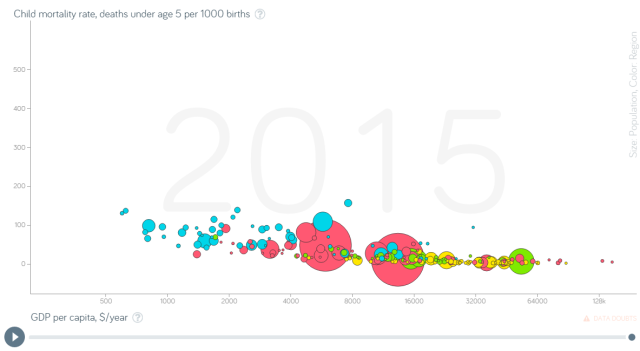
So, at a glance of the snapshot of 2015 affairs, we see a great disparity between the light blue and the rest of the world. Picking a nation, “Burundi”, I enable trail and look for major points of inflection.
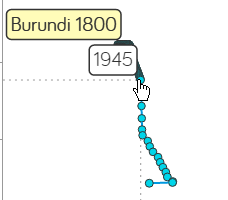
In 1945, child mortality starts dropping at a more accelerated pace. Cross referencing Wikipedia, significant events within this time frame were:
1940 : Classified as a United Nations Trust Territory under Belgian administrative authority.
1943: Powers were split in the legislative division of Burundi’s government between chiefdoms and lower chiefdoms. Chiefdoms were in charge of land, and lower sub-chiefdoms were established. Native authorities also had powers.
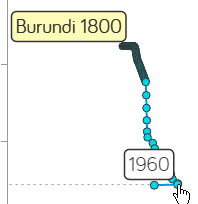
In 1960, we start seeing a decline in financial prosperity, while mortality rates fluctuate slightly. Again, according to Wikipedia, significant events in this time frame were:
1959: On January 20, 1959, Burundi’s ruler Mwami Mwambutsa IV requested Burundi’s independence from Belgium and dissolution of the Ruanda-Urundi union. In the following months, Burundian political parties began to advocate for the end of Belgian colonial rule and the separation of Rwanda and Burundi.
Don’t read this wrong, these are just the facts Jack! Perhaps not enough of the facts at that. I am an advocate of independence. However, it seems that there was a financial price for Burundi’s independence which took a decade to recover from financially. Family income declines from $632.00 to $531.00 with a gradual recovery over a 10 year period of time.
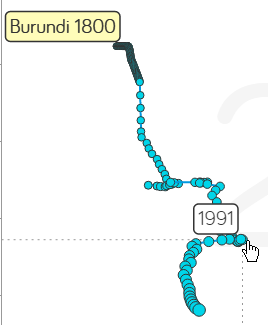
In 1974, the trend of increased financial prosperity became a decline until 1991 when things again started to turn around. Wikipedia, what happened?
1992: The government promulgated a new constitution that provided for a multi-party system. Civil war broke out.
1993: A first attempt at democracy. June 1993, Melchior Ndadaye won the first democratic election and became the first Hutu head of state, leading a pro-Hutu government before being assassinated in October of 1993. 300,000 people were killed in the following few years, but it looks like very few of them were 5 and under.
With so many unregistered deaths, obviously, a single view is not a complete view.
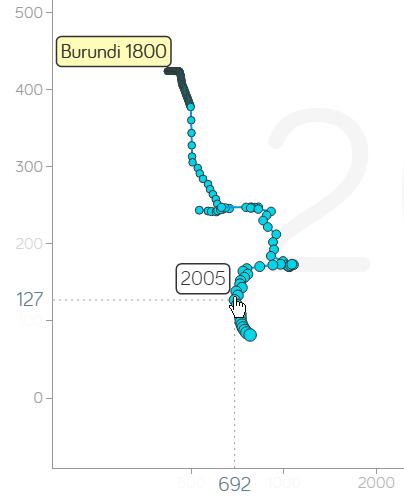
Finally, 2005 brings what looks to be a decade of decreasing Child mortality rates with an increase in prosperity (though very much poverty level on a global scale).
Trans-formative events around this time frame appear to be:
2000: On 28 August 2000, a transitional government for Burundi was planned as a part of the Arusha Peace and Reconciliation Agreement. The transitional government was placed on a trial basis for five years. After several aborted cease-fires, a 2001 peace plan and power-sharing agreement has been relatively successful
2003: A cease-fire was signed in 2003 between the Tutsi-controlled Burundian government and the largest Hutu rebel group, CNDD-FDD (National Council for the Defense of Democracy-Forces for the Defense of Democracy). Domitien Ndayizeye (Hutu) is elected president.
2005: Ethnic quotas are formed for determining positions in Burundi’s government. Pierre Nkurunziza (Hutu), once a leader of a rebel group, elected president.
2006: UN reconstruction efforts seem to take effect.
I never expected to learn so much about Burundi when I started this post. I didn’t realize that it was another country riddled with Tutsi/Hutu conflict. What’s all that about anyway? So I google:
500-1000 BC : The Hutus, an agricultural people, settle in the Great Lakes region of Central Africa.
1600 AD: The Tutsis, also known as Watutsis, a nomadic people, begin arriving from Ethiopia. They settle peacefully among the Hutus – adopting their language, beliefs and customs.
Gradually…economic differences form… Tutsis as cattle herders often being in a position of economic dominant position over the soil-tilling Hutus. As the Tutsis gain more dominance, the minority begins to rule the majority. Resentments form…
Over time, the Tutsi and Hutus has evolved into more of an economic difference rather than an ethnic one as explained by Charlayne Hunter Gault, Professor Izangola:
“In Rwanda, the Tutsi and the Hutu are the same people. They are all people–large grouping or communities which go from seven regions of Cameroon to Uganda–all the way to South Africa, in the same culture,” Izangola said. “People used to be Tutsi or Hutu, depending on the proximity to the king. If you were close to the king, you owned wealth, you owned a lot of cattle, you are a Tutsi. If you are far away from the king, you are a cultivator, you don’t own much cattle, you are a Hutu.”
Colonial rule, which began in the late 19th Century, did little to bring the groups together. The Belgians, who ruled what would later become Rwanda and Burundi, forced Hutus and Tutsis to carry ethnic identity cards. The colonial administrators further exacerbated divisions by only allowed Tutsis to attain higher education and hold positions of power.
All I can say is wow…till next time…
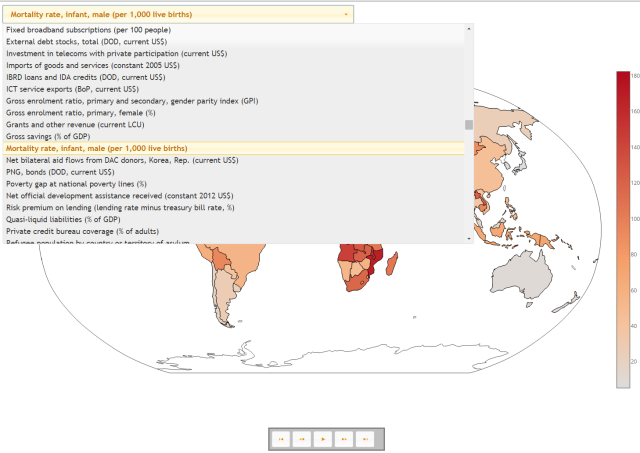
Previously, I posted a visual of a single time-series against a global heatmap based upon the World Development Indicator dataset from the World Data Bank.
So I wondered, could I display all the series from this dataset? This is no small task as it consists of over 18 million datapoints spread across 1,345 series for 248 different countries and country aggregations.
Having had my site hacked a number of times, rather than worry about exposing a restful service to the internet, I decided to use an in-memory database. Sure the initial load will be slow, however, exploration itself would be fast.
Initially, it took me over a day to load the datapoints into sqlite. However, I didn’t get it right the first time. As Larry Wall once said, Impatience is an virtue of the developer. Impatient, I tried to figure out why my insertion rate into sqlite was only 211 entries per second. Turning autocommit off and committing every 1000 insertions increased my performance by roughly 4000 times. Once that change was made, my 24 hour load times became 3 minutes.
The schema I settled on looks like:
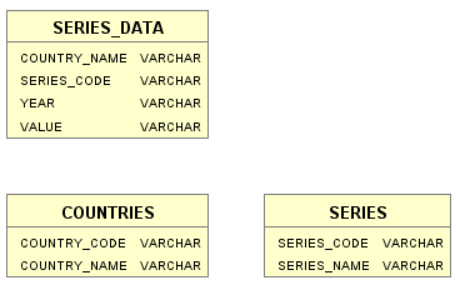
On my local machine, it takes around 8 seconds to initialize the application. From there, I can explore all 1,345 development statistics across time in a Gapminder like setting.
For a limited time, I will keep this link active so that others may also give it a try:
However, due to the fact that the sqlite database is over 500 megs (mostly due to indexing), I will likely take this offline in the near future.
-rwxrwxr-x+ 1 Patrick Patrick 423095296 Mar 6 19:49 wdi.db
Do not click this link from a mobile device! It will surely fail and expect it to take awhile to load! While the banner: “Please wait, the data is loading…” is displayed; THE DATA REALLY IS STILL LOADING.